User interface overview
The Rana Desktop Client consists of five components:
Main menu
Toolbar: the Rana Schematisation Editor toolbar, a button to open the Rana panel, and the Rana Results Analysis toolbar are already added to the toolbar.
Panels: the Rana Processing Algorithms QGIS Processing Toolbox.
Layer panel: Here the available layers will be shown
Open Tabs: Here you can toggle between different tabs, such as the processing toolbox and the Rana panel
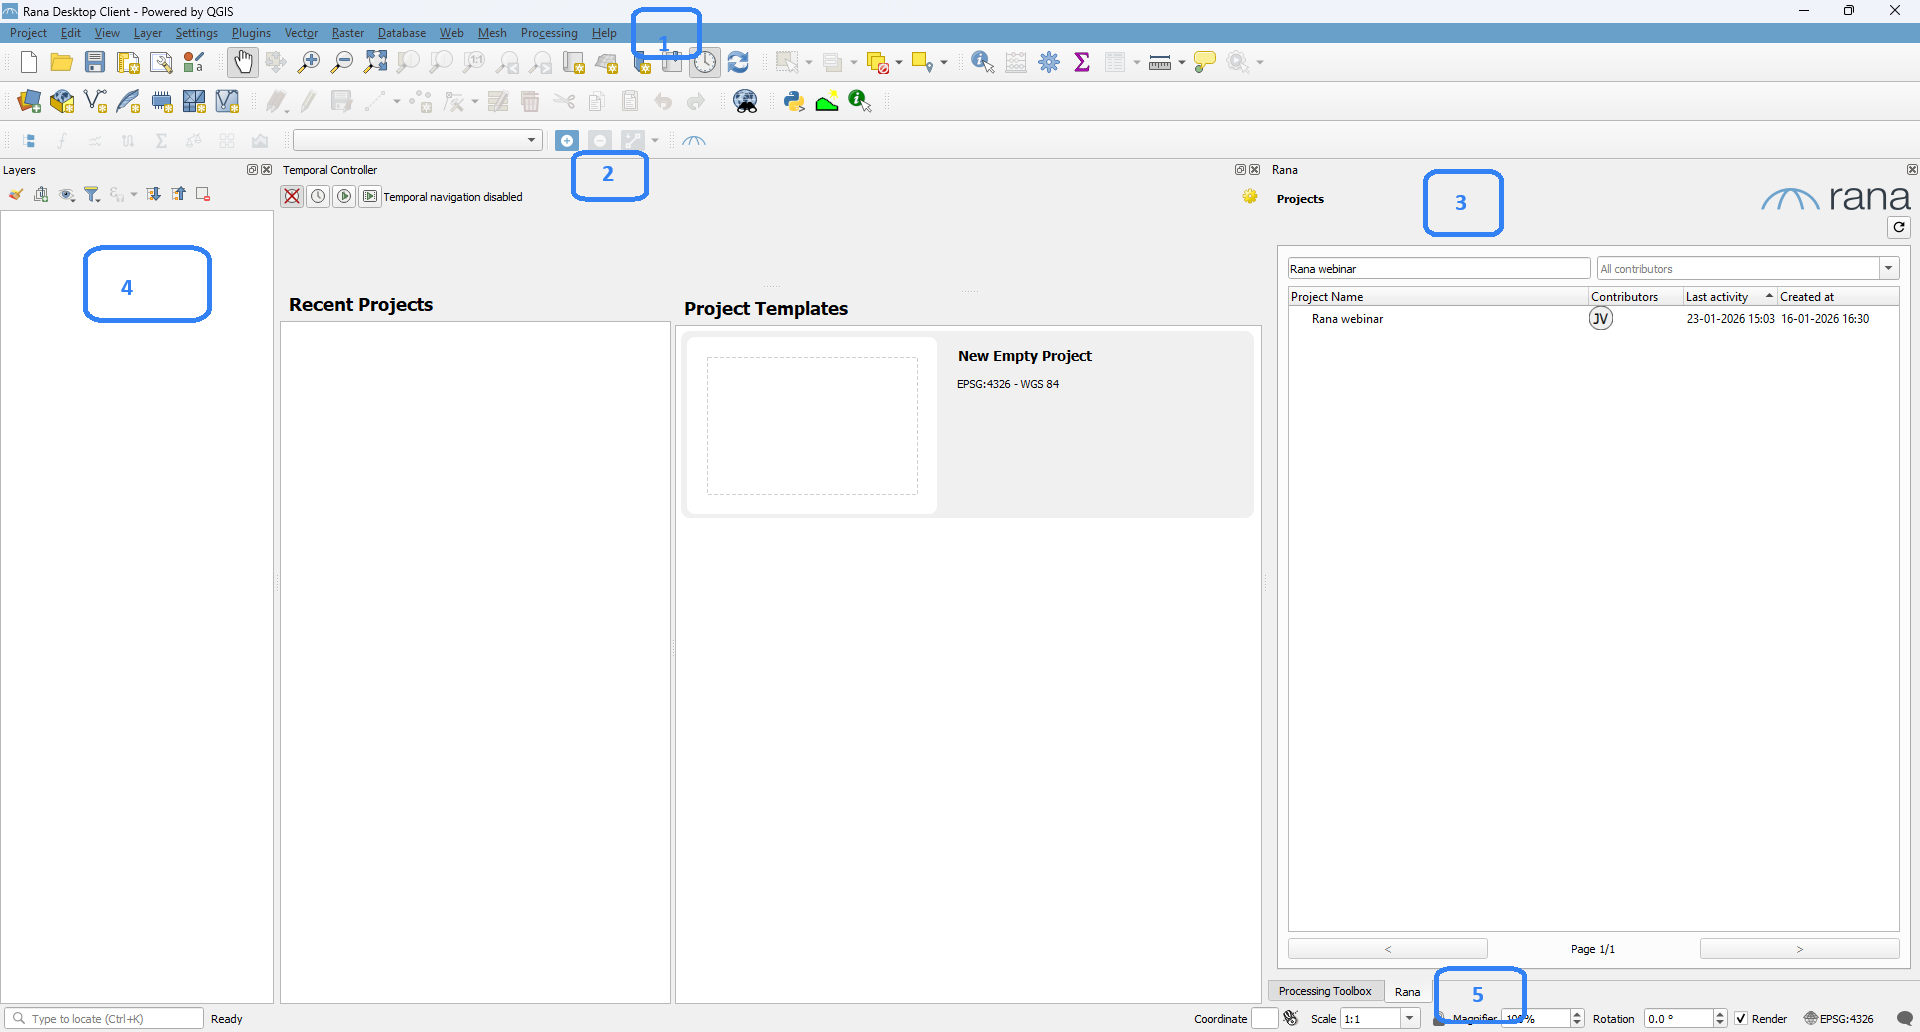
Fig. 12 Overview of the Rana Desktop Client.
Rana Schematisation Editor toolbar

Fig. 13 Rana Schematisation Editor toolbar
In the drop down you can see the active schematisation, when more than one are opened you can use the drop down to toggle between them.
Load Rana Schematisation: Loads your schematisation in the Rana Desktop Client, directly from locally stored geopackage.
Remove Rana Schematisation: Removes the schematisation layers from your project.
Import schematisation objects: Gives you the option to import data from other GIS data into a Rana schematisation.
Rana Results Analysis toolbar

The Rana Results Analysis toolbar gives you access to all the Tools for analysing results in the Rana Desktop Client.
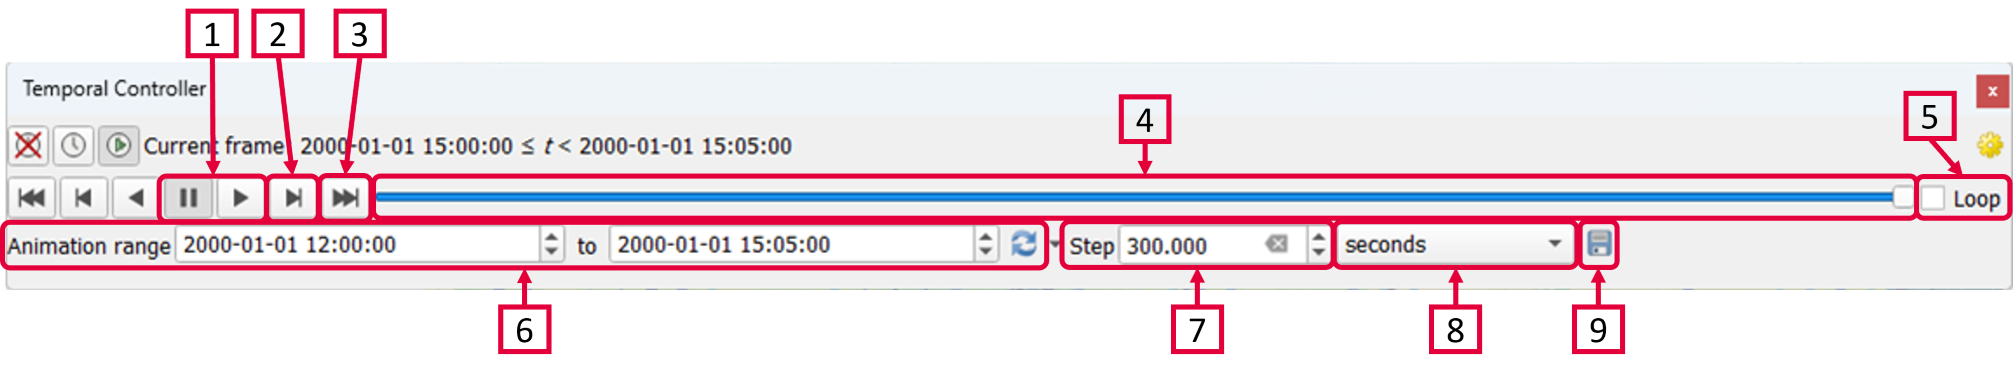
Temporal controller
When you load your results the Temporal Controller will automatically appear at the top of your screen (if it was not already visible). With the Temporal Controller you can see and analyse the results through time. The Temporal Controller is a native feature of QGIS and can also be utilised in combination with other results tools. To use this tool, you first need to click the  in front of the desired results in the Results Manager. If you have loaded more than one set of results, the
  shows the set that is used in the visualisation. Click the again to stop visualisation of the results.
The results are visualised on the flowlines, 1D nodes and 2D computational cells (see Results NetCDF for more information on the possible flow-variables).
Pause or play the animation of the results through time.
Skip to next frame.
Skip to last frame.
Move the slider to visualise the results at different timesteps.
Check to automatically reset and repeat the animation endlessly when running the animation.
The temporal range that is used for the visualisation. Note that the default range that is shown is the range used in the simulation.
The steps per frame. Here the steps frame are shown every 300 seconds. Note that this shouldn’t be smaller than the used output timestep in the simulation.
The units that correspond to the number of steps [6].
Export the results as png’s for every or any timestep.
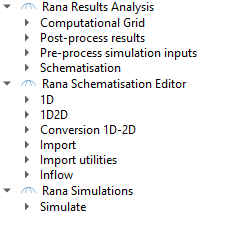
Rana Processing Algorithms
Many Rana related actions can be performed by running a Processing Algorithm. These can be found in the (QGIS native) Processing Toolbox. To open the processing toolbox from the main menu, click Processing > Toolbox. Alteratively, you can click  in the attributes toolbar or use the keyboard shortcut CTRL + ALT + T. Scroll down to the sections Rana Results Analysis and Rana Schematisation Editor to find the Rana-specific processing algorithms.