Tutorial 2: Run a Simulation and Explore Your Results
Introduction
In this tutorial, you will build on the work from Tutorial 1. You will create a 2D flood model of your study area, run a rainfall simulation, and explore the results including the water depth map. Finally, you will learn how to share your findings with stakeholders using Rana’s publication tools.
Assumed knowledge
Basic knowledge of how to navigate Rana’s Web Platform, covered in Tutorial 1.
Learning objectives
With this tutorial you will:
Create a 2D hydrodynamic model of your own study area
Run a hydrodynamic simulation
Generate and interpret a water depth map
Communicate your findings effectively to stakeholders through publications
Preparation
Before you get started:
Complete Tutorial 1. You will need the study area and datasets you created there.
Step by step
Creating a 2D flood model
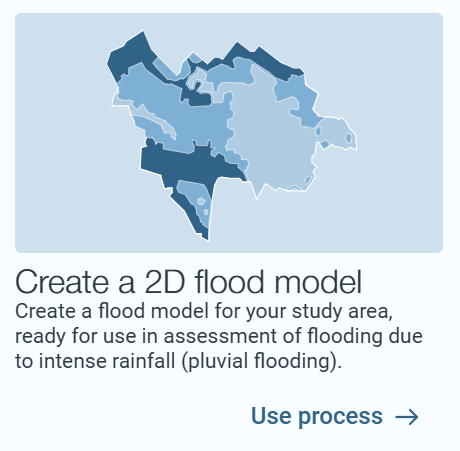
In Tutorial 1, you gathered various datasets and defined your study area. Now you will use these to create your own 2D flood model. Go to Processes and click on Create a 2D flood model, then read the information shown.
Use the study area you defined in Tutorial 1 as input.
For the elevation data, you have two options: select a dataset directly from the catalogue (the required data will be extracted automatically), or use Select your own file to reuse the elevation dataset you already retrieved in Tutorial 1.
Note
If you select your own elevation file from Tutorial 1, you can skip the grid size step below.
If you did not select your own elevation file, set the grid size to 0.5 m.
Choose a clear and descriptive model name, save it to a suitable location, and click Run Process to create your 2D flood model.
Tip
The model creation may take a few minutes depending on the size of your study area. You can monitor its progress in the Processes tab.
Running the simulation
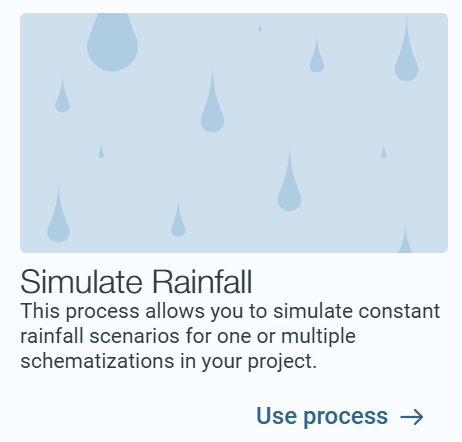
Once your 2D flood model is ready, go to the Processes tab and open Simulate rainfall.
Select your model as input. Set the following parameters:
Simulation duration: 120 minutes
Rain duration: 60 minutes
Rain intensity: 70 mm/h
Give your simulation results a clear name and save them in a folder called Results. Create this folder in the Files tab if you have not done so yet.
Click Run Process to start the simulation.
Once the simulation is complete, go to the Files tab and locate your simulation results.
Tip
In Rana, your simulation results are stored as a Simulation file type.
Open the results file and explore the preview.
Tip
Reflection: Take note of the results visible in the preview. The water depth map shows where water accumulates during the rainfall event. Which areas show the highest water depths? Are these in the expected low-lying parts of your study area?
Sharing your findings with stakeholders
Another key feature of Rana is the publication section. Here you can combine data and results and share them with stakeholders. Stakeholders can view your results and leave comments, enabling you to collect real-time feedback.
Go to the Publications tab and create a new publication (
 ).
).Choose a descriptive name that clearly reflects the content. For example, include your study area name and the simulated event.
Add the water depth map and any other relevant results to the publication. Think about the story you want to tell your stakeholders: what happened during the simulated rainfall event, and where are the problem areas?
Go to Open Viewer. Here you can drag layers up and down to set the display order and turn layers on and off.
Tip
Order your layers thoughtfully in the viewer. Place your most important result on top so stakeholders immediately see the key finding.
Note
To share your publication with stakeholders, click
 . Give your publication a suitable name and set an expiration date. Once published, you can share the link. Stakeholders can open the link, provide their email address (used only to identify comment senders), and view the publication. No Rana account or licence is required.