Tutorial 3: Advanced Analysis — Identifying Vulnerable Buildings
Introduction
In this tutorial, you will analyse the flood vulnerability of buildings within your study area. Using the simulation results from Tutorial 2 and building datasets from the Rana catalogue, you will determine which buildings are most at risk.
This is one of the advanced result analysis processes available in Rana, providing deeper insight into the impacts of flooding on the urban environment.
Assumed knowledge
Basic knowledge of how to navigate Rana’s Web Platform, and completion of Tutorial 1 and Tutorial 2.
Learning objectives
With this tutorial you will:
Extract and use building datasets from the Rana catalogue
Determine the flood vulnerability of buildings using your simulation results
Communicate your findings effectively to stakeholders through publications
Preparation
Before you get started:
Complete Tutorial 2. You will need the simulation results from that tutorial as input for this one.
Step by step
Extracting building data from the catalogue
In Tutorial 1, you may have already noticed the BAG (Basisregistratie Adressen en Gebouwen) in the catalogue. You will now extract this dataset for your study area. Go to the Catalogue and find the BAG dataset.
Take an extract by clicking
 . Open your project, select your study area as the extraction boundary, and use the default resolution.
Save the extract in your Data folder with a descriptive name and run the process.
Go to Files and locate the BAG file you just extracted.
Tip
Open the extracted file and explore its layers. Each layer contains specific building attributes that describe the properties of individual buildings.
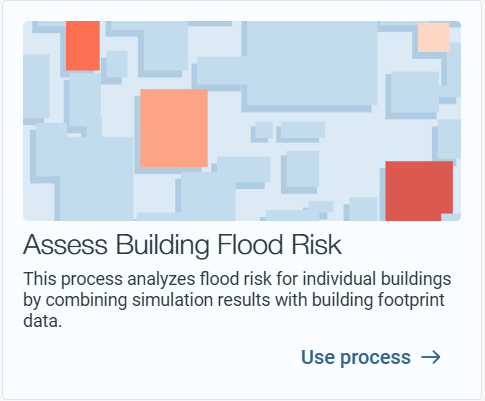
Assessing building flood risk
Once you have your BAG data, go to the Processes tab and open Assess Building Flood Risk. Read the information shown before proceeding.
Select the simulation results from Tutorial 2 as input.
Select the BAG buildings dataset you just extracted. Keep the flood risk calculation method set to the standard DGBC.
Save the output to your Results folder and click Run Process.
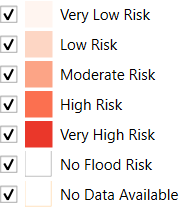
Once the process is complete, go to the Files tab and view the results in the preview. The following standardised legend applies:
Tip
Reflection: Which buildings in your study area are most vulnerable? Do the results match your expectations based on the water depth map from Tutorial 2? Consider the relationship between water depth and building vulnerability.
Sharing your findings with stakeholders
Now that you have your results, share them with stakeholders. Go to the Publications tab and create a new publication. Choose a descriptive name.
Add relevant data to your publication. Include both the water depth map from Tutorial 2 and the building vulnerability results to give stakeholders a full picture of the flood risk in your area.
Prepare a short pitch (1–2 minutes) about your study area and the current water-related risks. Explain what the data shows and what it means for the buildings in the area.
Tip
A compelling pitch combines visuals with context. Show where the water accumulates, then show which buildings are affected and explain what action could be taken.
Note
To share your publication with stakeholders, click
 . Give your publication a suitable name and set an expiration date. Once published, you can share the link. Stakeholders can open the link, provide their email address (used only to identify comment senders), and view the publication. No Rana account or licence is required.